Early Career Projects (2022-24)
Featured on this page is a collection of various projects (mostly web and field map based) completed during the first portion of my career at the City of Wenatchee and Franklin County.
City of Wenatchee
Pangborn-Herndon 1931 Flight - Misawa, Japan to Wenatchee, Washington
This story map is about the historic 1931 flight completed by Clyde Pangborn (a native of Bridgeport, about 50 miles northeast of Wenatchee) and Hugh Herndon Jr., the first non-stop flight across the Pacific Ocean from Misawa, Japan to Wenatchee, Washington, detailing the flight from the planning to the legacy that is forever etched into the Wenatchee Valley.
As part of the City of Wenatchee's GIS Internship program, interns are tasked with creating a Story Map in ArcGIS Story Maps of any topic that relates to the Wenatchee Valley. This final project is assigned early on in the internship, but interns have the entire internship period (six months) to complete it. I left the internship early to take a position in the Tri-Cities, but I was able to finish the story map before leaving.
After considering a number of topics including the Missoula Floods and the Columbia River Basalts, I developed a curiosity about the history behind the Pangborn Memorial Airport, the main airport serving the Wenatchee Valley. After researching the history behind the name, I became more fascinated due to my general interest in aviation, and I ultimately selected this as my topic.
Franklin County
Culvert Inspection Field Map
Click here or scroll down to see a description of the final product.
Franklin County has more than 1,000 culverts under roadways throughout the county with the purpose of maintaining waterflow and preventing flooding which could cause damage to county roadways which would be costly to repair. Occasionally, the culverts need to be inspected and maintained to uphold proper functionality.
A few years before I started, a survey team went out with the maintenance crew to inspect each culvert. The survey team would capture the location of each culvert while the maintenance crew would measure the length, diameter and depth of each culvert and inspect the condition of the pipe. Their observations would be marked on a paper form that would be filled out for each culvert, then added into a culverts layer back at the office.
Early in my position at the County, I was tasked with coming up with a way to digitize the culvert inspection process, integrating the existing Culvert layer to avoid having to remeasure everything. I knew right away using ArcGIS Field Maps would be the best option, but before I could start on this project, I needed to learn how to use Field Maps and the department needed to obtain an iPad tablet.
About a year later, I obtained a tablet and began construction on the Field Maps app. After overcoming multiple obstacles, receiving assistance from the County Road Administration Board's GIS Team, and attending a Field Maps workshop at the 2023 NWGIS Conference, I was able to build a digitized version of the paper culvert inspection form in ArcGIS Field Maps using the new Smart Forms feature.
In December 2023, I went out with a couple of maintenance guys to teach them how to use Field Maps for culvert inspections and to note areas of improvement that could be made to the form. I did end up finding a number of areas of improvement, and used Fridays to make these changes when the road crew was off.
The Culvert Inspections Field Maps form consists of two feature services that were pulled from the original culverts layer, which contained the coordinates, pipe measurements and condition report of each culvert. The original culverts layer was split into a culvert point layer consisting of the coordinates and pipe measurements; and a inspection record table layer consisting of the inspection records - both layers linked using a common Culvert ID field. Culvert IDs consist of the road number and milepost of where the culvert is located (i.e. 10000-3.40 = Road #10000 milepost 3.4).
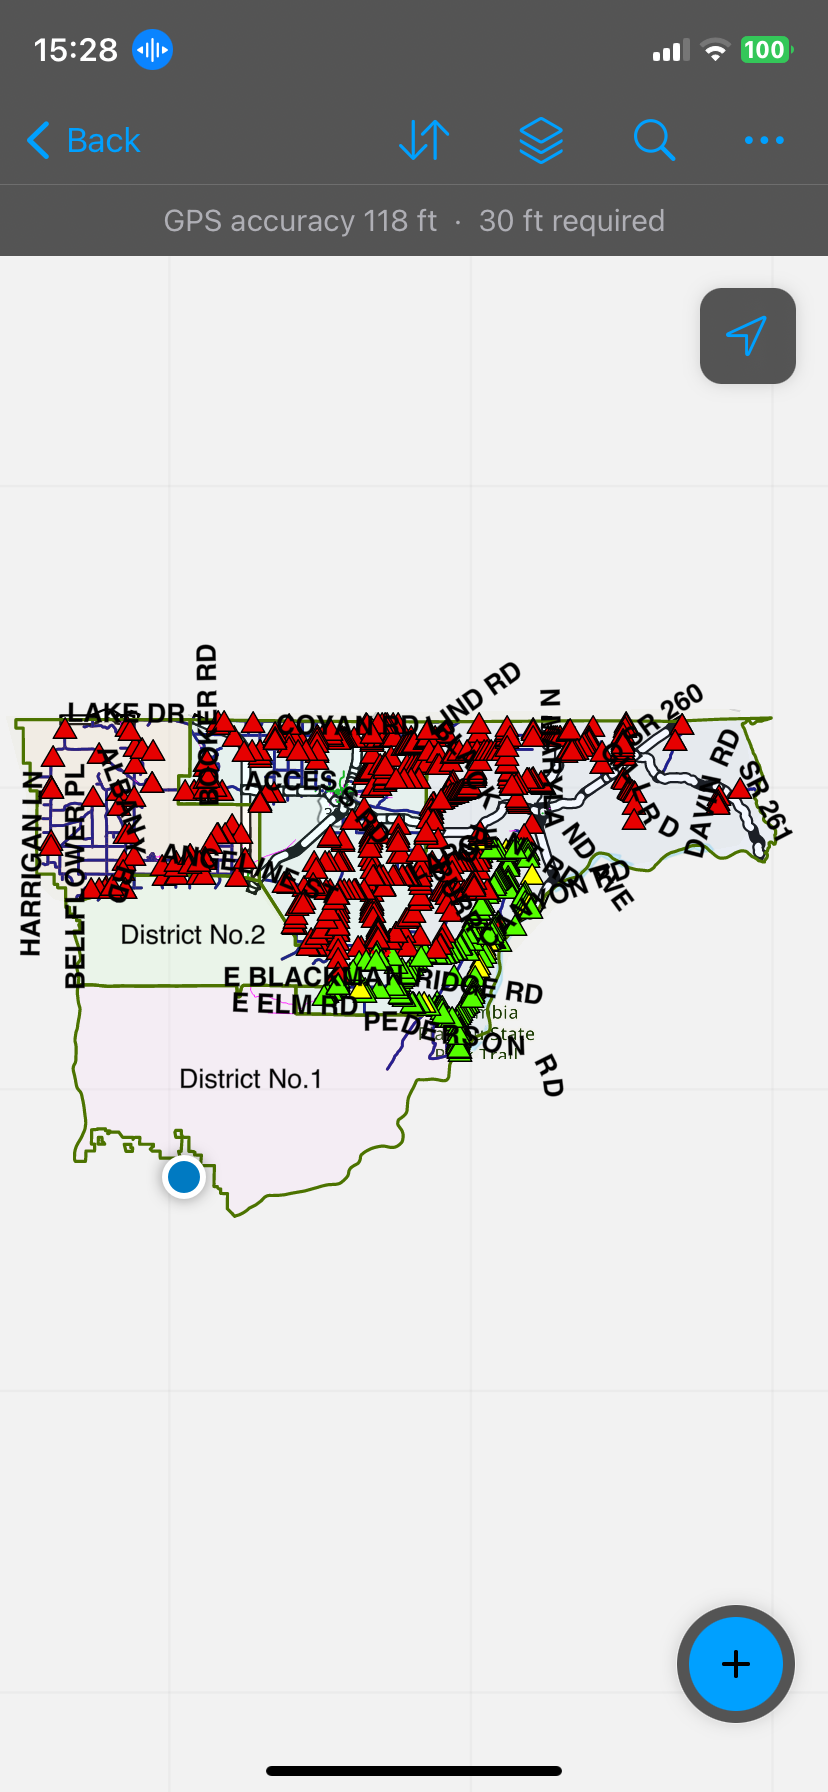
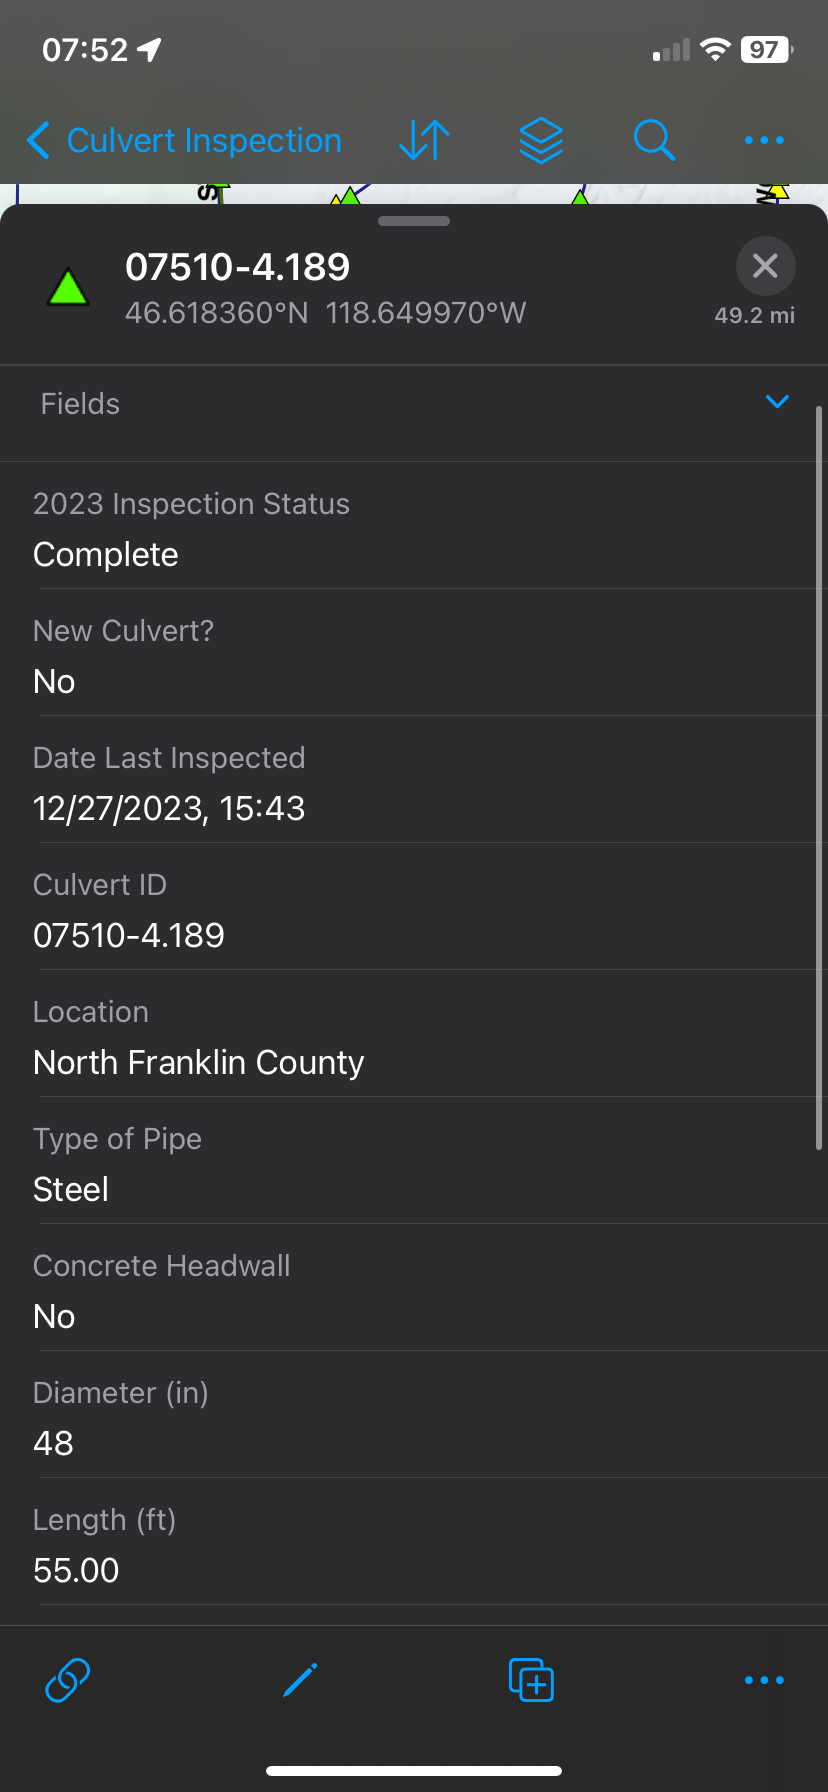
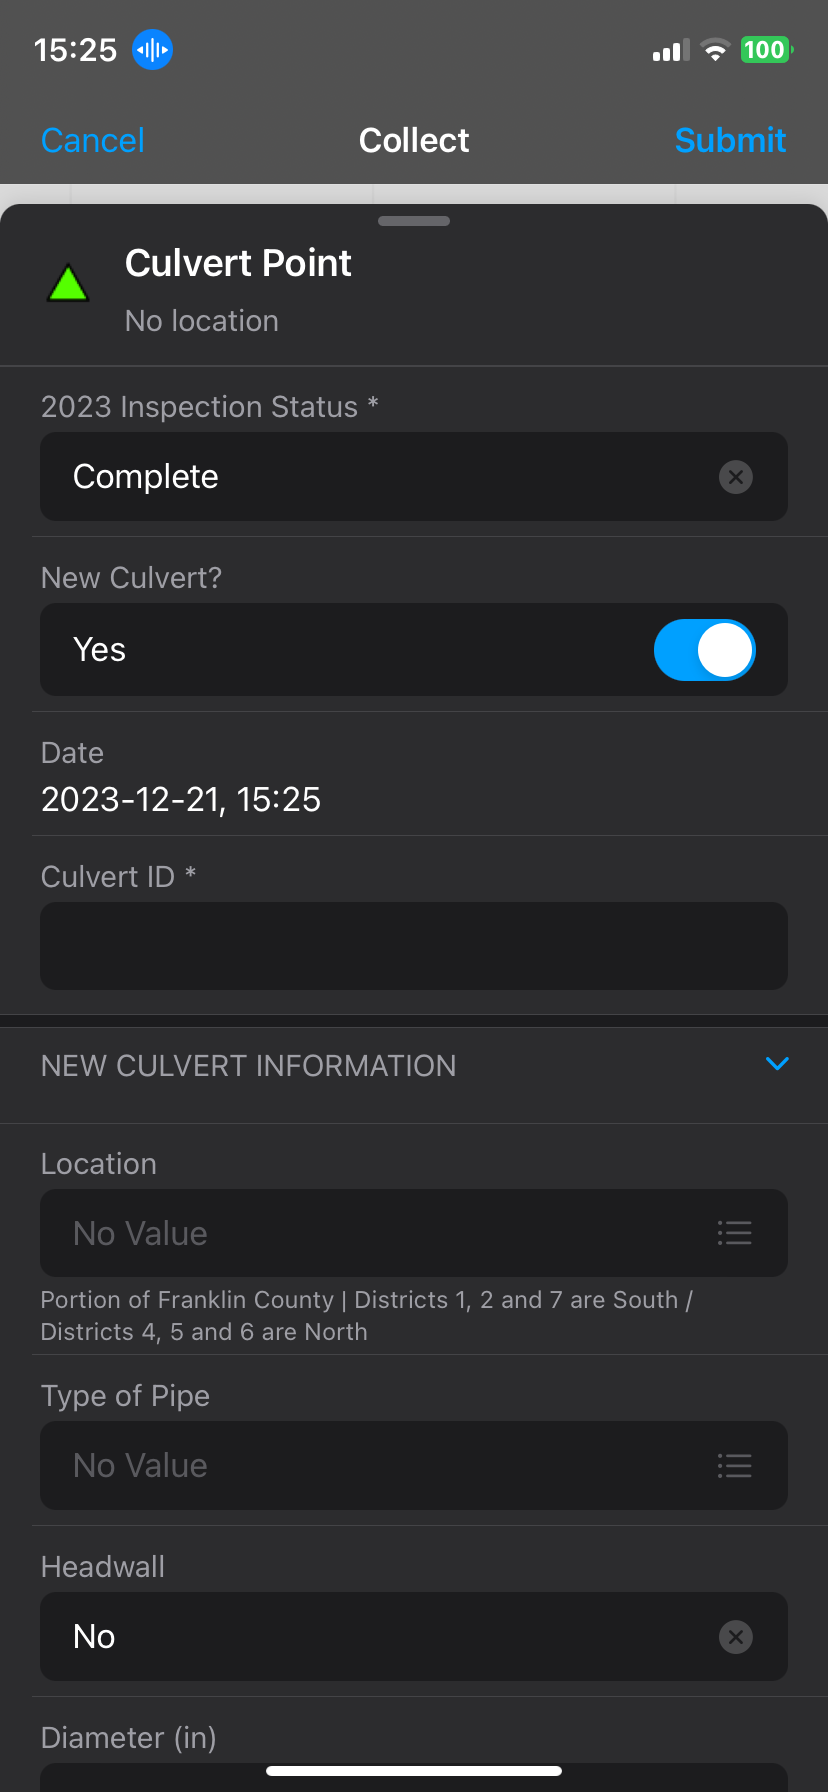
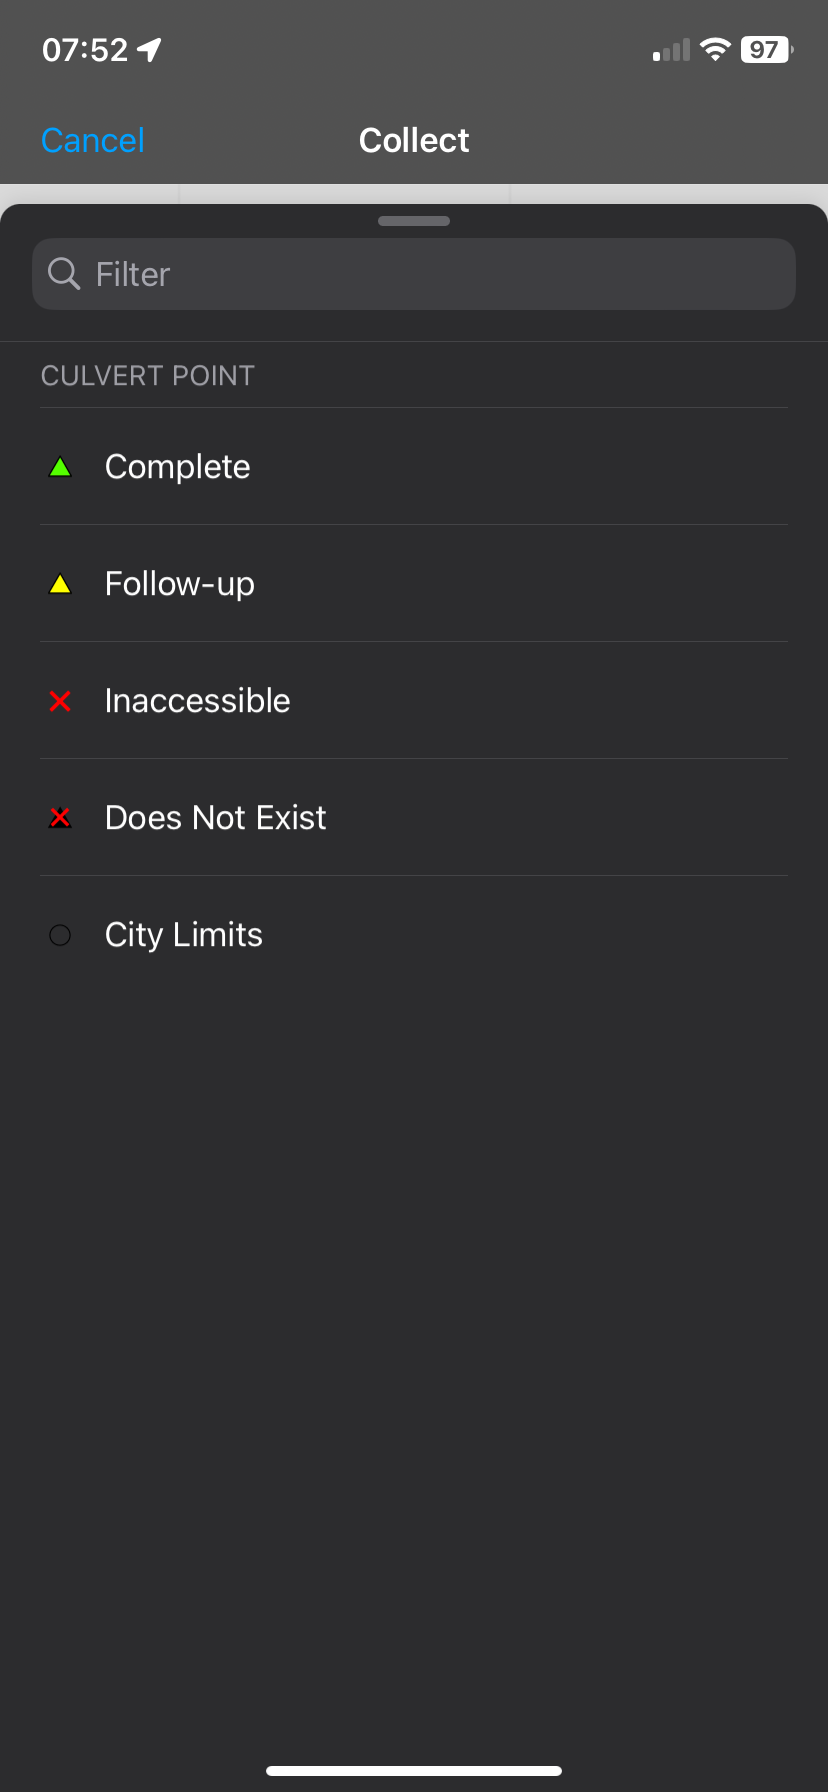
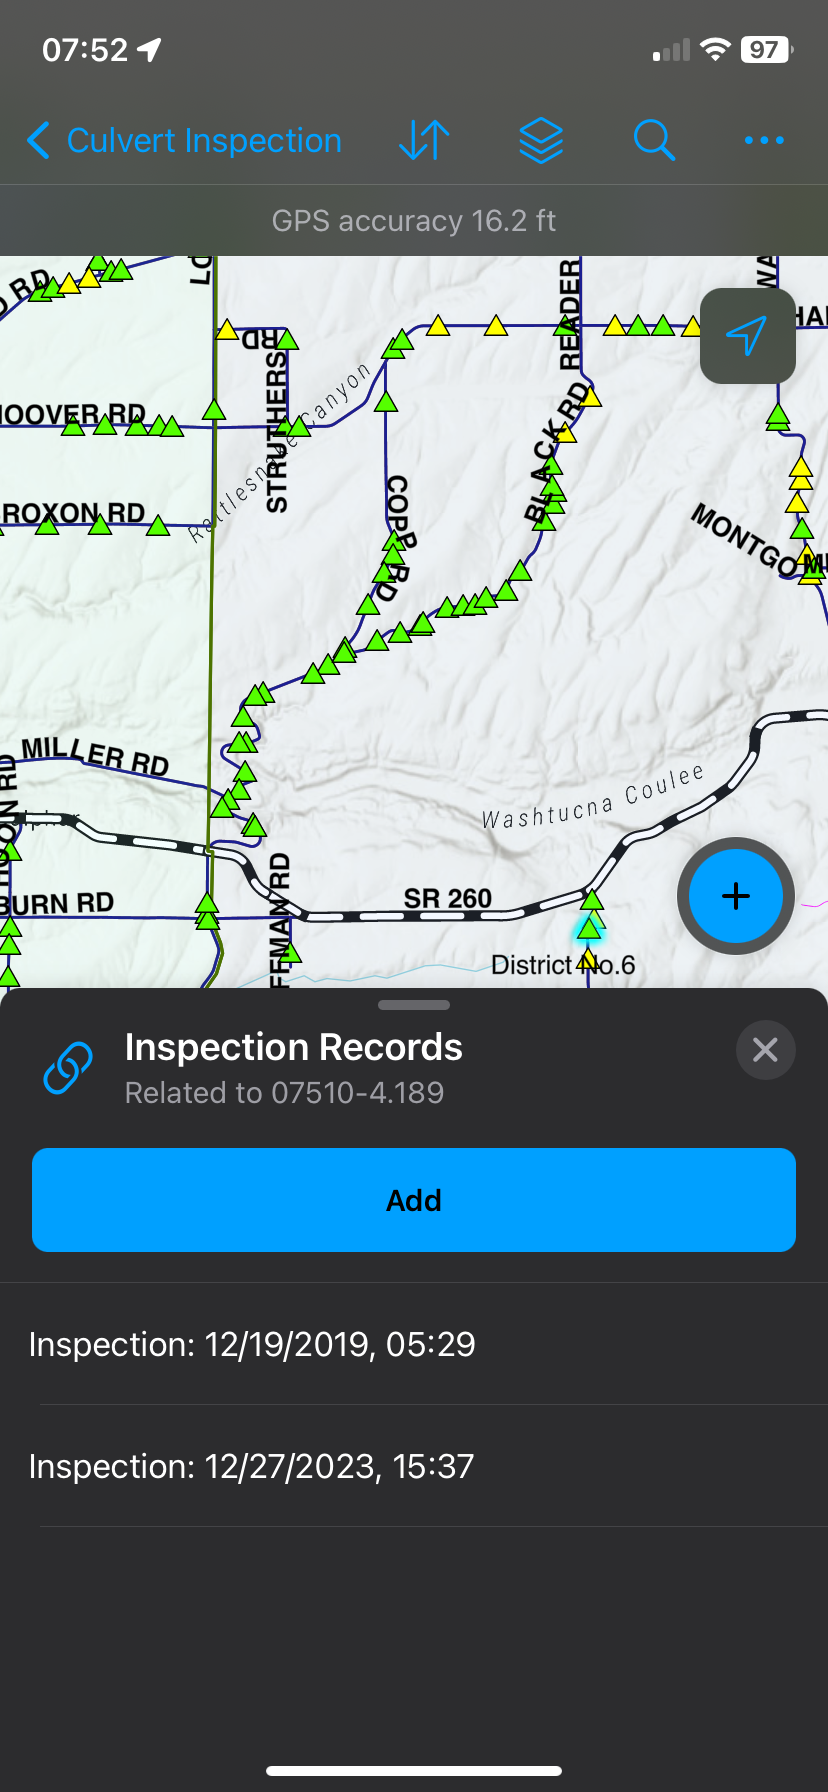
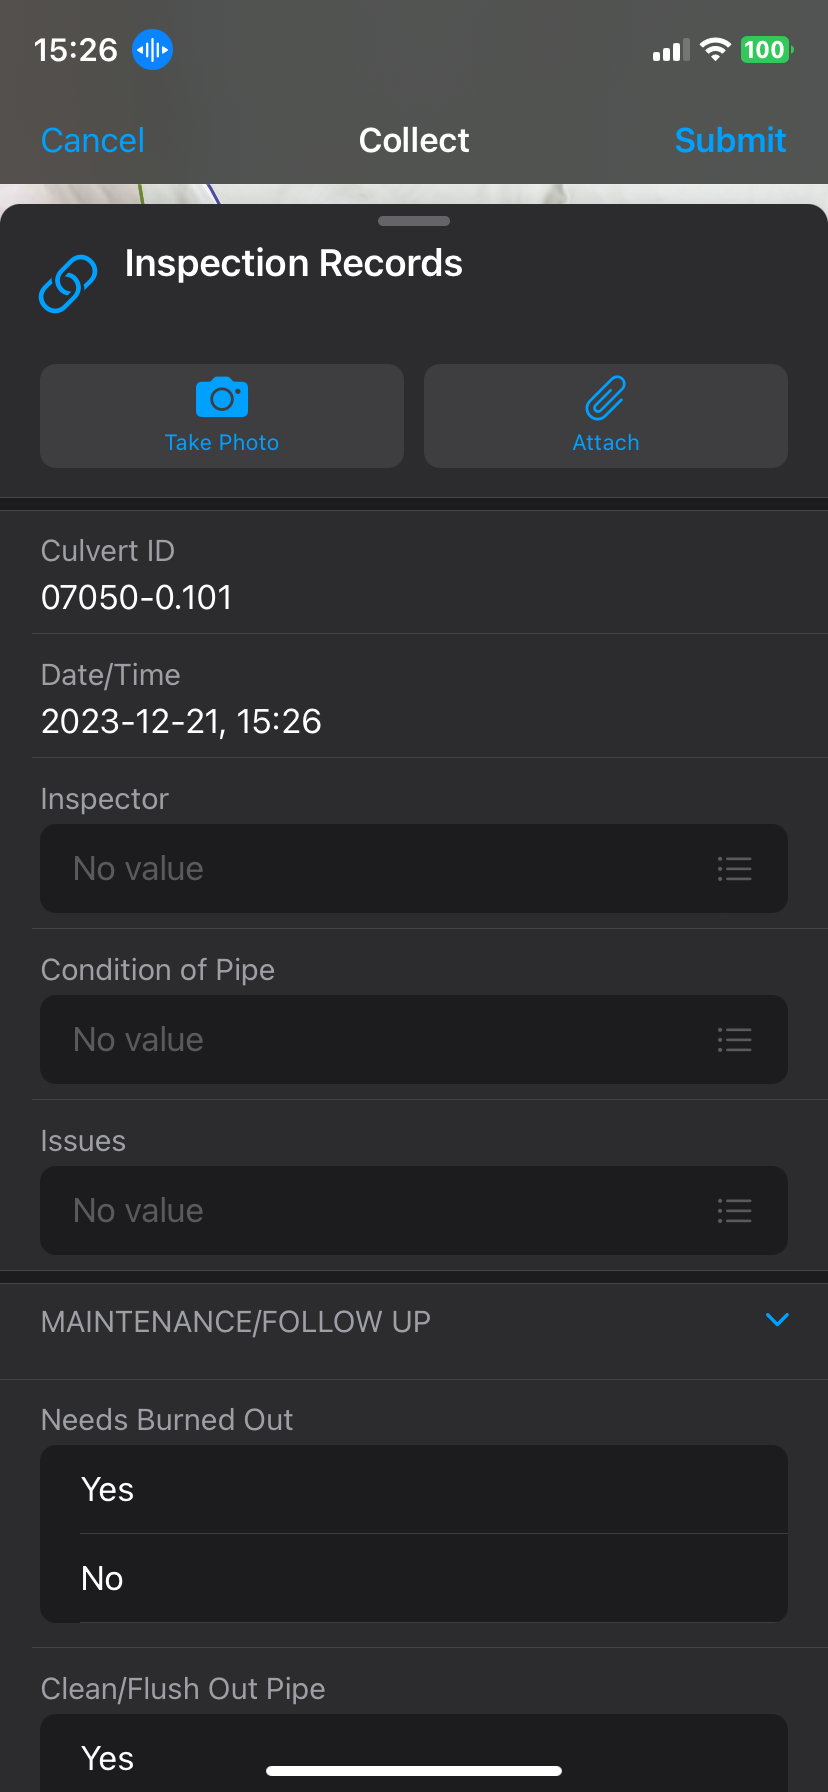
Screenshots of the Culvert Insepection Form are shown on the left, and are in numerical order with the process detailed below:
- This screenshot shows the offline culvert inspection map while inspections were ongoing. The culvert points in green and yellow have been inspected, while the points in red have yet to be inspected. The culvert inspection crew was good about updating the Status field, so it was easy to keep track of which culverts needed to be inspected, and it helped them determine which the quickest routes.
- This screenshots shows the filled out culvert point form. The 2023 Inspection Status field for keeping track of inspection status while the New Culvert? field was for keeping track of which culverts were not previously located. The bottom fields of the form contain information and measurements of the culvert pipe, and are already filled for existing culverts (New Culvert? value = "No").
- This screenshot shows the form in edit mode, and with the New Culvert? field switched on (value: "Yes"). As you can see, it triggers the Culvert Information field group to allow users to fill in the information for new culverts. The Date field is already calculated thanks to Smart Forms, while the Culvert ID field should already be filled out for existing culverts. For new culverts, any unique value could be entered, which I would go back and assign later.
- This screenshot shows the list of options for the 2023 Inspection Status field value, which updates the symbology of the map shown in the first screenshot. Culverts that haven't been inspected yet don't contain a value, and this are given a red triangle on the map. Green means the culvert is in good condition, yellow means the culvert needs following-up (will be detailed in the next screenshots), and the X symbols mean the culvert is either inaccessible or it doesn't exist (or is buried too deep). The black circle means the culvert is now in Pasco city limits and is no longer the County's responsibility.
- This screenshot shows the list of inspection records associated with the culvert point. This particular point shows that the culvert has been inspected twice - once in 2019 and once in 2023 (which at the time was done a few moments ago). The inspection record list is accessible on the Culvert Point form at the very bottom (not shown on any of the screenshots).
- This screenshot shows the Inspection Records form in edit mode. The Culvert ID value matches that of the culvert point and the Date/Time field is automatically calculated. The values of the Inspector, Condition of Pipe and Issues fields are set via pre-selected options known as domains. The next several fields are for maintenance/follow-up if it's necessary, which can be collapsible for culverts in good condition. This form is also where pictures would be taken of the culvert and submitted along with the field information.
In summary, culvert inspections using ArcGIS Field Maps took just over a month to complete, and I would say it was a huge success. I did a presentation on this project at the Local GIS Network meeting in Kennewick in January 2024.
